Organize, Analyze and Report your TP Data in one Platform
ValuePricing's data platform provides you with all the tools to create consistent, customizable and data-enabled transfer pricing analyses. Create a single source of truth with the TP data management Module, calculate the relevant metrics and share the reports with your findings.
Creating a single source of truth in four steps
Extracting, organizing, and segmenting data forms the core of effective TP operations. Our TP data managment module streamlines this process. Additionally, our platform maintains transparent data versioning, providing you with the capability to track modifications and gauge the implications of adjustments.
A streamlined way to define your model.
A clear and guided process to define your platform built to conform with the OECD guidelines.
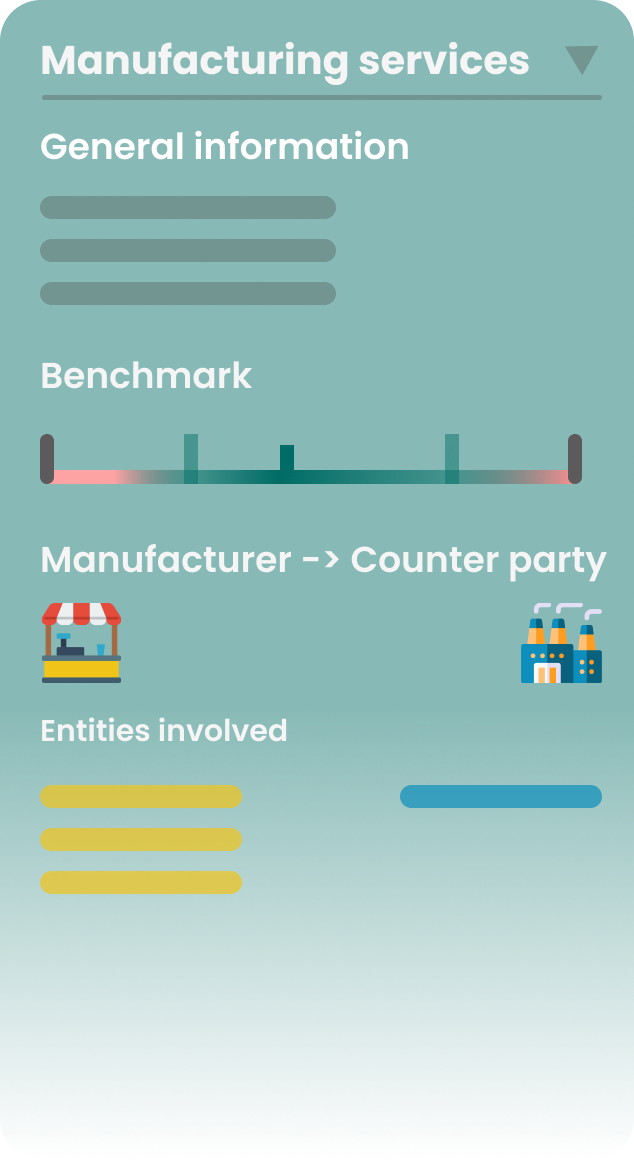
Communicate your model with ease
Easily communicate your model to your stakeholders online and in a visual way.
Automated checks for compliance
By specifying countries and connecting benchmarks, you never have to miss a deadline or renewal date.
Document your finding and share the results
Converting data into insights and refreshing reports can be challenging. Our reporting module simplifies this process, offering the options you need to get TP relevant insights and add your observations. Once satisfied, you can effortlessly share your report, including your comments and the underlying data, with your stakeholders.
Create TP relevant insights
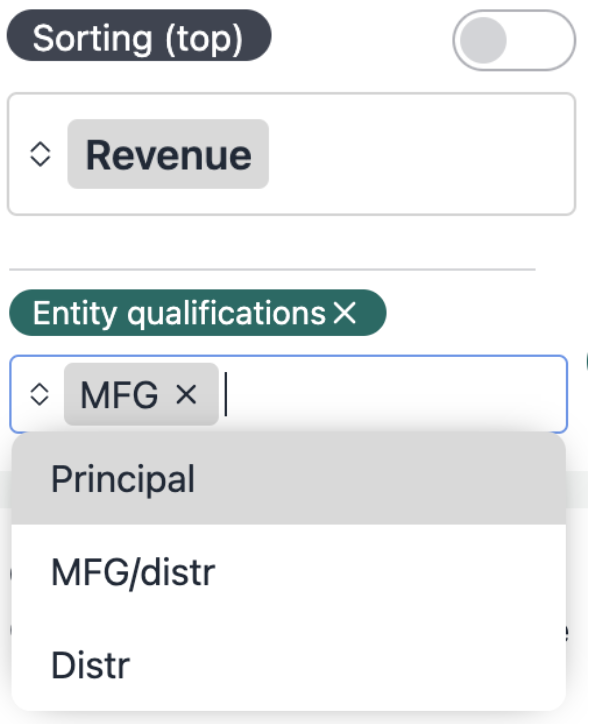
Filter and sort based on entity profile, region, and division to compare oranges with oranges, and sort by revenue or any other criteria.
Focus on filtering small and risky entities by setting a threshold for revenue, margin, or any other relevant factor.
Views creeate custom views and add additional pages with the specific insights you want to save.
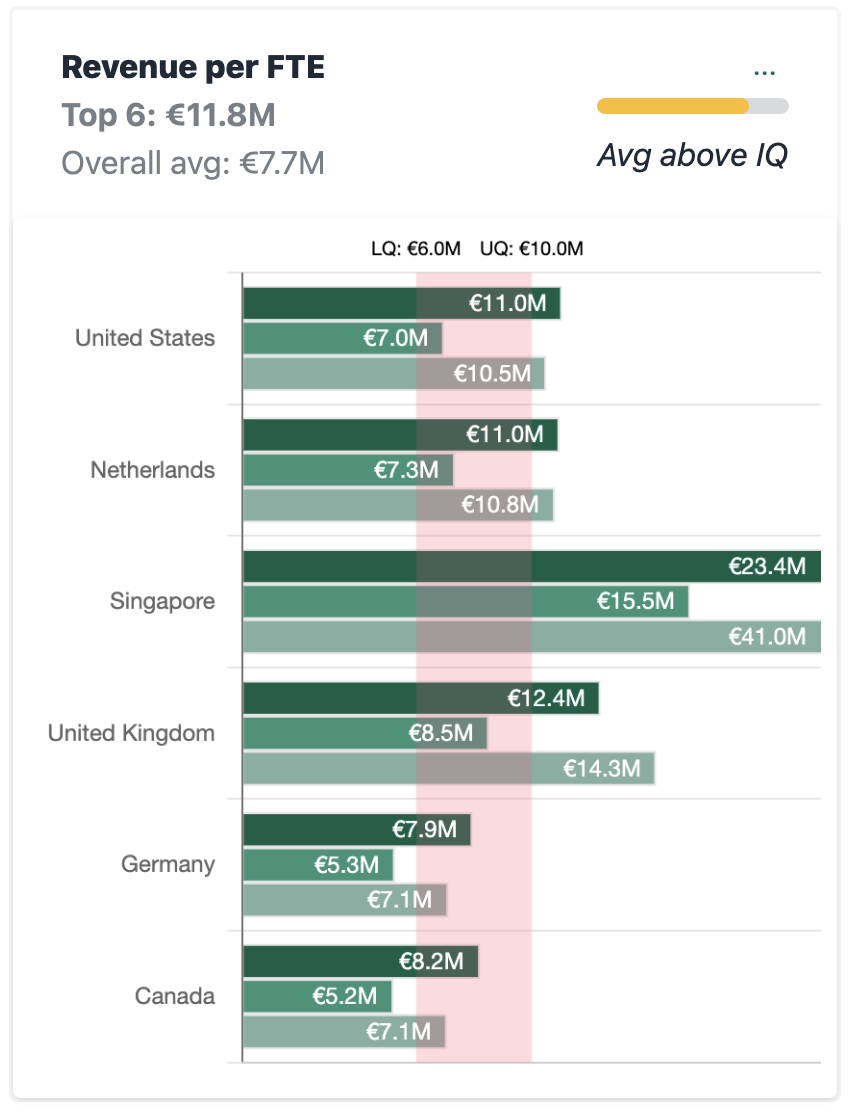
Spot outliers with mutltiyear data and expected ranges
Use the measures KPIS defined by the OECD or create custom measures.
Add expected ranges and multiyear data to discover outliers and trends
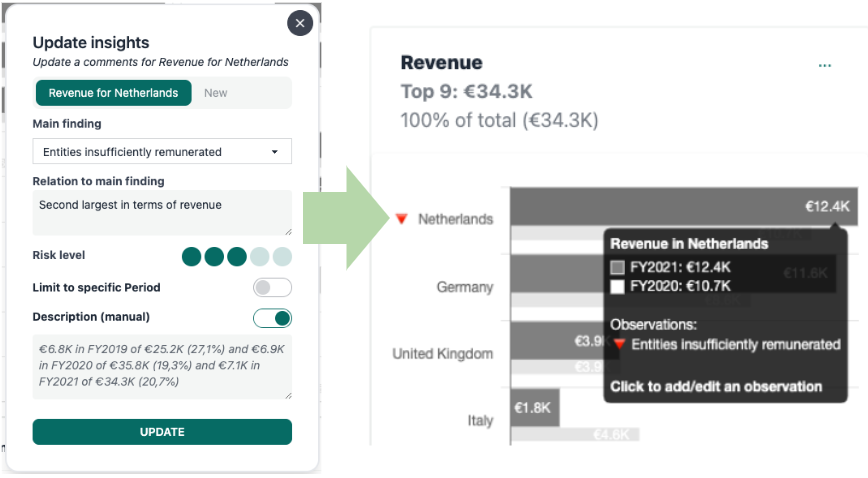
Document your findings and share the results
Add finding when you find something which you want to explain or discuss. Your finding will be connected to the specific entity and calculation, so you and others can find it easily.
Save and share once you have created the right views added all of your findings, save the report and share it with your team.